One of those services I offer is detailed, analytics suite. I use Google Analytics and upgraded and amplify it a little bit so that my clients have an amazing opportunity to get to gather insights and a really meaningful and visually pleasant way.

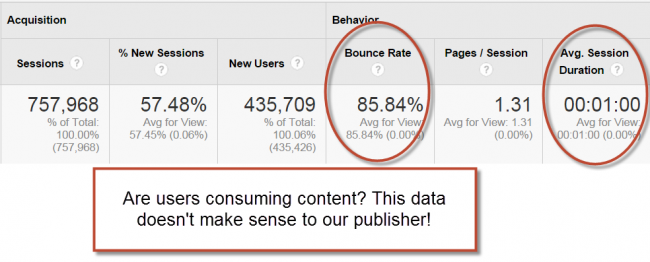
So here we can see this company has several hundred visitors a day on average twelve visitors at this exact moment in time, while I’m logged in they have one visit our online. That person looked up directly I’ll, show you some of the cool things that you can learn your the amount of data and insight they can find is really wonderful. For example, you see how many different sessions different times people logged in we can see the total number of visitors, the overall number of pages that those visitors viewed the average time on site.
Many of these are SEO. Metrics also that Google and the search engines look for and factored into their algorithms as they’re determining which nights to rank they like when people stay on websites and engage and consume the material, they don’t love. When people bounce off a bounce means someone lands on a fair amount of people are going to do that because they’re coming looking for information, something but part of the SEO game is figuring out ways to entice and engage people to dive deeper and stay longer.
On the site, so the average number of pages for this session is I’ve got a large number of new sessions. So it means new people who haven’t been to the site are finding it clean. It obviously good things. Expanding the brand. Look at that cool visual, their percentage of visitors, a new meaning, six percent, compared with returning thirteen percent they’re, so very helpful to know the devices are villiers.
Would you imagine that over 50 % of what traffic occurs on mobile devices now, and so many of us myself included often think and from a desktop point of view, a desktop image point, and it is important and critical to assess and optimize the mobile version of Your website because, for example, this particular website 627 percent of traffic cones via a mobile device. Now we can actually see particular pages that people are landing on number of views response time.
I can dive deeper, two more pages on the site and it’s really helpful to know which pages are bringing people to the site. For example, if you have a blog post or some other content, that is very valuable. That item we can see how many people are brought to the site via that particular post. For that particular page, and as your online presence and content power grows, you will have more opportunities to gather people to your site.
This is a really cool tool. It’s called a heat map and it allows people to see where people are actually moving their cursor and and clicking, and what what elements of your site are working for them, and so I definitely highly recommend that so these this is a good snapshot of analytics and What we can do for your company in terms of giving you data and insight and metrics that can help you develop and have continued to improve and expand your online SEO strategy thanks.
So much
