Categories
Online Marketing

How to: New Google Analytics Widgets & Dashboard

Everything around just took a quick tour of it myself, and I wanted to show you guys. Some of the features when you first log into a sight, you’ll notice that you’ve got some default widgets here. This is what they shou yuan sort of like your home screen.

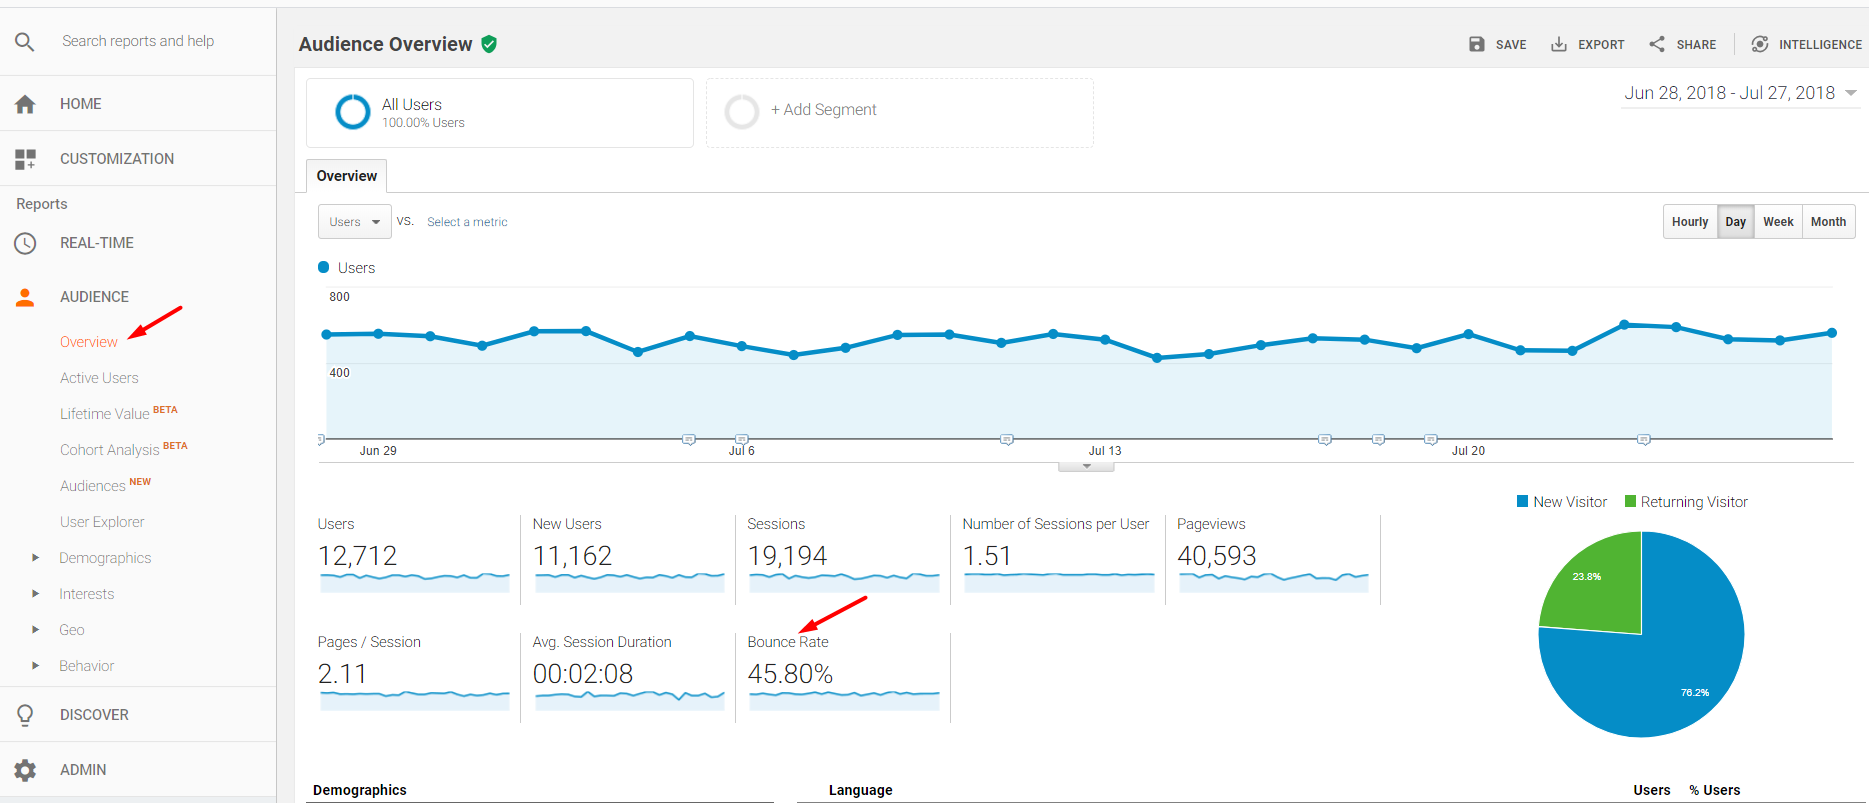
They call it the dashboard, and you see this is a site that it’s not really in use right now, but it still get some random traffic. It’s got a couple of visits, it shows you, you know how often people bounce off of the site. It shows you where the people are coming from and then just like normal you can, you know, change the dates you can say compare this to last month or well, last period of time that we want to look at.

So that’s that’s all they’re still you’ll notice that all of these widgets now have a little gear next to them, so you can actually change whatever the widget is. So if I, for example, I didn’t want visits, but I only wanted to have new visits there. Then I could change this widget and it would just change so what they’ve done is they’ve broken up these different metrics in two different categories.

So you see you’ve got the things called metrics which are sort of one-dimensional here and show you a number. That’s all they’re really going to do. You’ve got a pie chart you can compare things. That’s like, for example, this country code over here you’ve got a timeline which you may be used to seeing the you know visits per day and then you’ve got a table where you can actually see some metric and different values of that metric displayed next to some Dimension in this case, the dimensions are like one example is page title, so what I’ll do is right now just go ahead and create a new widget, and let’s, let’s make this a table and dimension that I really like to know is the page title, because sometimes I’r working on blogs that don’t have human friendly, URLs or legacy systems, where i’m not able to stick that in there.

So i’ve got page title, and so that actually show me is you know whatever you see in the search search engine result page for example, and then I like to say, let’s say how many visits to that page get and then the second metric. Sometimes I like to see how many people exited from that page or sometimes I like to see how many of those were new visitors you’ve got a lot of different options here. But let’s just go ahead and for this one pic exit and then it called it visits, because that was the first metric I picked, but really what I want to call this is pages or page titles or something like that and then, if you actually have gone Through this interface you’ll see, you can add a URL that will take you deeper within Google Analytics right here from the dashboard.

So really, this is for people kind of know what they’re doing, but I have played with this little bit. It works really well. So then you save that and then let’s say that I just want to take this may be down here. It’s all very drag-and-drop. I don’t really care about this being right up front. So now I’ve got there’s my pages and then the other one that I always really like to know is like how are people coming to the site, so I’m going to do another table and this time for the dimension, I’m going to look the keywords and just As you type it will autocomplete, then again, I want to say how many of them are visits and then in this one I want to see how many people search for that and then exited right away.

So i’m going to call this widget keywords and again I could put the link there if I wanted to just as an example Ryan price Mediacom. Just because we know that we can’t – and there you see it will show up – is like a little on a piece of paper and it will take you to whatever site it. Was you clicked? I think the normal ideas that you’re going to have a URL somewhere inside of Google Analytics. So in this case the keywords it says not set, meaning that this is probably direct traffic or a link of some sort.

So they didn’t come from a search engine result. Page when they found this website, so that’s a little bit about setting it up. You can also create new dashboards so right now they all all of your site’s come default with one dashboard. One thing that I didn’t really like is that, at least as of yet there’s no way that I’ve seen to copy the widgets or the dashboards from one site to another and also from one user account to another.

If you have, for example, you and then your business partner, both need to look at this analytics for the site, you both have to set up the dashboards individually and you have to duplicate all of your work. So this can be a little bit of a challenge and hopefully they’ll introduce some sort of a method for getting at that in the future. I’r one more that I set up was a pie, chart operating system operating system right, oh and then the metric here would be visits.

This is backwards, the other one we started with the dimension and we move to the metric this one’s backwards. So you can show up to six slices, that’s fine! So the last the sixth slice will just take other operating systems. And again I don’t want to name this visit. I want to name it operating system, and now you see that seventy-five percent of the visitors to this website or from windows, twenty-five percent or from iphone.

Obviously, if this were a more popular site, you’d see more slices but okay. So I just wanted to show you this with a site that had a little bit more working statistics on it. This is for florida, creatives, calm and you’ll see on one thing. For example, the timeline here you’ll see that the peaks and valleys of traffic, so for some reason on this week, on tuesday and wednesday, we had a lot of traffic come in on the site and then we can actually change us.

We don’t want to see visits versus visitors, you could see visits versus bounces, and so this can be a good way of knowing you will see. The this side is the actual metric for visits, so the highest is somewhere around 80 and then this side is the highest for bounces. So it’s somewhere around 50. They look like they’re the same but they’re actually on two different scales, so you kind of have to be adept at reading graphs to realize this.

We’ve got 74 visits and 41 bounces, meaning that and you could actually get I’m sure, there’s a there’s a way to get the bounce right in here too. But it’s a little over half of the people visited one page only and then probably hit the back button or closed that tab, whereas on the following day, even though it seems like there were more bounces just the way that you read the graph, so you can See the the average bounce rate is about sixty-five percent for this particular website.

Again, you can see where people are coming from. I’ve set up that pages, widget Keir will do visits any exits, so you can see that the majority of visits it will sort by this. First metric majority of the visitor coming into the home page: that’s the the generic home page title and then the second most popular page for this month. Anyway, is this cooking classes, page and you’ll, see based on the keywords to these? Are all directed traffic or non search engine traffic, whereas these next to Florida creatives that’d, probably bring you the home page, cooking classes, Orlando, that’s the second most popular page, so that kind of makes sense.

And then here the operating systems, majority windows, but a lot of Macintosh users on this particular site. And then we also have some iphone ipad. And then these not set are probably search engines or other sorts of scrapers. And then the other is just because I sold only have six, so I could probably make it more and i’d see tiny slices that were smaller than three percent. If I really wanted to, and that’s a little bit about the dashboards and widgets on the new google analytics


Categories
Online Marketing

Google Analytics – How It Can Help Improve Your Business

So I talked a lot about with my clients, the smart objectives. So this is objectives for your business or for your website or anything what you do in life, which is so the smart objectives are specific, measurable, actionable, realistic and time-bound.

So in regards to Google Analytics the important one is M for measurable. So there’s no point in having a website out there. If we’re not actually learning about whether that website is working for us, you could have 10,000 visitors coming to your website. But if you don’t know that 10,000 visitors who come to your website and be what those visitors are doing when they get to your website, there is absolutely no point in having a website at all.

It’s just of no use to your business, so I would thoroughly and encourage you whether it’s Google Analytics or any other stats tool and to have a a tool on there, which is grabbing those stats for you. So you can learn about your audience and how better to engage them. One of the first benefits of installing Google Analytics on on your website is actually its influence. It has on how your your website gets indexed, so if you’re using analytics and Google automatically knows that you’ve added a page to your to your website so and how it does this is when that page goes live you go and look at it.

It triggers Google Analytics and to load, and then it says oh well, this is a new page. I need to add it into my index unless you’ve switched it off using the robots and txt file. What this means is so Google also has a an automatic submission tool, so you have to manually sorry not on automatic and manual submission tools. You have to go and submit your your web pages manually. This just takes that that take takes out that extra step, so so long as you’re using Google Analytics.

Google knows, and whenever you add a new website web page to your website and it’ll index it within I’ve, seen it happen with the matter of hours 24 hours evening. The second tip which I’ve got is about understanding your visitors. So the key thing about the visitors to your website is looking at the they used to be called unique visitors, but it’s now sessions. They introduced that within the last sort of twelve months people used to talk about hits now hits could mean that you can load up a single webpage, but there could be a hit for every image that loads on that page and for the JavaScript in for the Style sheets – and things like that, so one webpage could generate 50 hits.

So that’s why we’re really interested in unique visitors or sessions to the website, because these are individual, unique people who are visiting your website. And this means that you can average that that data out over a period of time and see how many individual people are coming to your website and interacting with it over a and you know a minute-by-minute. If you want to get real-time information, but probably most people look at their stats on a daily, weekly or monthly basis, and this just allows you to give benchmarks and what those benchmarks allow you to do is that if all of a sudden, you see a dip In your website traffic, you can react to it so if, for example, you’ve uploaded a page of content which violates Google’s Terms and additions, for example, so they’re no longer listing your page and search engine, you can react to it D list that page go and tell Google about it and hopefully get that traffic back up because don’t forget nowadays, most people to validate a business they’ll go and have a look at their website.

If your website’s not being indexed in Google they’re, not going to be able to find you equally. If most of your website, traffic is driven through organic and search engine results, and your website disappears off planet you’re going to lose that business, your business could go under so keeping an eye on how your website is performing. If you start to see it tail off, you can react and hopefully and build that traffic back up to where it was before.

The third thing I want to talk about is and the different what a pageviews and fountain what constitutes the bounce rates? It’s a really common. I do a lot of workshops in this and it’s the most common question. What’s the bounce rate, so bounce is basically when somebody lands a new homepage and they leave without engaging with the site or basically doing anything, so they don’t scroll down. They don’t click on the link, they don’t read a article.

They don’t do anything and by default, that period of time is 30 minutes, and so, if somebody landing site doesn’t do anything with it for 30 minutes, then that’s considered to be a bounce. You can manipulate that. I think you can tell Google to reduce the bounce rate on your website if you want to, but typically if I mean, if they haven’t done anything in the first sort of 10, 20 30 seconds, probably unlikely to do anything with your website.

Anyway, so so Google displays this bounce rate metric and through analytics. The next thing I want to talk about is goal conversions and funnels so goal conversion. I talked about in a previous article about and the three things that happen within seven seconds. So the message you’ve got to get across is who we are, what you do and where do you want your customers to go to next so that where to next is and what we call a goal conversion? Ultimately, we want something to land on your website and either and pick up the phone or submit a contact form or buy products for me.

So so you can tell Google and Google Analytics what that goal. Conversion is so, let’s call it a contact form submission. The funnel is how they reached that point. So we create a funnel. A simple funnel might be land on the homepage. They go to the contact page and then they hit submit so there’s three steps in that. Funnel we want to and the way the reason why funnels are important is, it might be the let’s say you have thousand visitors to the website.

100 of them hit the contact button, but none of them have, and none of them are completing the goal. Well. Okay, now, what we can do is see where customers are dropping out at that funnel. Maybe we’ve got too many form fields in the contact or maybe the contact forms is broken, so this gives us an opportunity if we see that as a dropping out our particular points in that funnel that you’ve created for them.

You can react totally web developer to go in there and fix it. One thing which changed and quite dramatically probably about two or three years ago, with Google Analytics and another question which I started to get asked quite often was you can you can have a look at the keywords which people have put into Google and view those on On through analytics to see what keywords people have searched on in order to land on your website and there’s this one specific keyword that people started to realize was just gaining in popularity for every single website and it was something called not provided.

So I kid you not at the top of the list keywords on everybody’s google analytics and starting to become not provided, and now it accounts for about 90 % of keywords which people search on so now, people aren’t actually searching for the keywords not provided and ended Up on ending up on your website, the reason why it’s happening is because most search is now on Google and, if you look at on the URL and you’ll, see a little padlock icon and it will say HTTPS instead of HTTP, you know forward slash, Google com, So those searches people are doing being pushed through a secure, socket layer, HTTPS so through a secure layer and what Google does is it just obfuscates them? So you can’t actually see what those keywords are.

So it does that for privacy reasons to protect the person who’s browsing the web so now you’re getting loads of really useless information about keywords through Google Analytics, which is really frustrating so the workaround for it there is a workaround, it’s pretty straightforward! You can install something called Google Webmaster Tools onto your website and if you’ve got Google Webmaster Tools installed on your website and you can actually see what and searches are being carried out and resulting in your web page being delivered in the search results before people get To your website, through and through Google Webmaster Tools, so you’ve actually got access to that list of keywords and through another Google tool, it’s just really frustrating that you can’t see it through Google Analytics.

So that’s the Google not provided workaround and which there’s more information about it on my website or if you google, for it I’m sure you’ll be able to find a plethora of different tips how to work around it. So, just to summarise those key points, the reasons why Google Analytics is really important. So first it talks about smart objectives. Google Analytics allows you to measure the prompt to your website and happy for interacting with your website, and it has an immediate impact on how quickly can get pages indexed in Google search engine.

We can see how many unique visitors are coming to our websites and and measure that on a regular basis, we can have a look at bounce rates and see see whether people are landing on the page and how well they’re interacting on it and how many pages They’re actually viewing and finally, we look at goal. Conversions been creating funnels to track people right the way through to a call to action which we’ve created for them and at what point they’re dropping out of that process.

So I hope you found the article really helpful and thank you for reading. Don’t forget if you want to read more articles than please hit the subscribe button and if you’ve got any questions about this specific article, then please leave them in the comments box below I’d. Be more than happy to answer them!


Categories
Online Marketing

4 Ways to Measure Social Media ROI

Also this, I think, determination in small Businesses that they’re like “ There is no way to do this.”, So they love to hear about Roi return on investment. You get asked this too right Right. They end up spending so Much of their time on there, they wan na make sure they’re actually getting something back, Which I totally get right. You’re time is super valuable, you’re doing a million other things and then now social media Is added to your plate? How do you justify the time or the money if you outsource it like GoDaddy Social, You wan na justify that time and money and a way to do that is understand.

Are you getting a return on investment And the good news is there’s a lot of ways to See if you are or not, There’s data analytics metrics, but I’m going to break it. Down into four umbrellas of how to measure ROI, starting with number one brand awareness Cool, how do you Measure brand awareness, So brand awareness can be measured in one way that you’re, probably Already thinking at home, your number of followers How many people are following you More people following you on Twitter, seeing your tweets following you on Instagram Seeing your great photos following you on Facebook and Reading those great captions, The more exposure you have and the more followers you have seeing it that’s brand awareness Perfect And does that count likes and comments, and things like that too Totally So likes comments.

Love shares retweets. That’s just going to help You get in front of not only your followers The awareness there, but your friends and their friends, maybe their family members as well, So the awareness just Spreads like wildfire Spreadin’, the love Spreadin’, the love All right, so digging in On the analytics aspect, It’s easy to see the amount of followers you see the amount of Likes and things like that, is there a step further? We can go to really see the nitty gritty Yeah totally.

So that’s a cool thing. If you have business pages set up, they allow you a clear view of what’s working. What’s not working what time of a day a post works? Well, how many people are seeing It et cetera, et cetera, So with Facebook, you Have your “ Insights” tab And, what’s really cool, is it breaks down a ton of information And they even have a little Information button on each one. So if you’re reading a Metric and it’s like “, I’m not even sure what Engagement rate means.

”, (, laughs, ). You know you click on it. It’ll break down what it is Perfect And Instagram too. You have To make sure you create a or turn your account Into a business profile that way, you can see insights and how many people viewed Your page liked it commented what time of the week you Get the most engagement If you’ve turned your Instagram account into a business page. Let us Know in the comments below Just say, “ I’ve turned It into a business page.

”, So that’s with Instagram Twitter there’s the top tweet. So you can see that in your Twitter analytics as well So go in. There see what Your audience likes, in other words your customers and then have that inform Your strategy moving forward, which will also help you be More efficient with your time and give the customer what they want, Give them what they want, Give them what they want: ( laughs, ) All right, moving on Tip number two: where are we at with that? So tip number two: one Of my personal favorites customer satisfaction And you’re, familiar with This inside your business, whether you have a barbershop Or a car dealership, you can see it on the person’s face that they’re satisfied or not.

I can’t make a frowny face: Aw Darn it I was cuing them up. So one way you can do it. Online with social media is well your reviews. Your customers are going to tell you if they had a poor experience. Or a great experience But make sure you’re Reading those reviews Believe it or not, I still Come across businesses that don’t take the time To read their reviews, I’m like “ Wait. This is a great place “ to see if your customers Are satisfied or not.

” Also what they’re saying when They mention you on Facebook, Right, Especially, you have to Respond good or bad. I know most people will just Respond to the good ones and try to just ignore the bad Ones like they don’t exist, Just give them a response. See if you can make it right, apologize to the situation and move on Totally So again pay attention to What your customers are saying, They’re talking to you online And if you wan na even a Deeper dive into that we have another episode of The Journey on social listening so check it out So cool statistic: I read the other day: actually, a quarter of people who have a positive Experience at a business will go and tell 10 people Both online and offline – That’s pretty awesome.

All right. Tell me What’s tip number three Tip number three is actually Gaining new customers, which is your favorite, I know When I say “ You’re Gaining new customers”, you can picture just dollar Bills in your pocket Make it rain, ( laughs ). So how can you do that with all this social Media and online stuff Couple ways: One: your customers are going to Click on your Google listing for their directions.

I know I do that before Every business I go to because I get lost very easily, But if I’m clicking on the directions, I’m coming to your business and I’m coming to spend Money with intent Also calling Calling you That’s another great way to measure that you’re getting a new customer You’ve already learned. That a lot of customers don’t take the time to call So if they’re calling You they mean business, they are serious about Spending money with you, You got yourself a new customer And so because the Google Listing’s really important Yelp and that “ Click to call” you wan na, make sure I’r sure this obvious that everything is up to date, The right phone number, the right address The hours right.

How many times have you gone to a business? That said it was open, you get there and it’s closed And that’s a bummer Just makes me so sad. So sad, And also besides that, if you have a chance to Speak about your business, maybe “ About You” or add Photos do that as well too and make sure that’s up to date, Maybe you’ve remodeled. Since the last time you had your Yelp photos. Updated or your Google Add that in there spice things up Take some photos, Keep it up to date, so When your customer comes in that new customer, you just gained they’re getting an experience.

That they predicted that they expected Right All right, so we’ve reached The end of our journey, We’re on tip number Four, the very last one: What do you got for us Brand loyalty, Another one you’re familiar With the terminology, but what does it look like online? Well, there’s, don’t worry, It’s not tough math, but well, let’s see how It goes for Justin here All right, engagement rate. How do you measure that? Well, it’s pretty easy.

It’s the number of likes You receive on a post divided by the number of followers times. You guessed it 100 And that’s going to equal Your engagement rate ( mumbles ), Oh no! No! It’s not that hard, So write it down, keep it nearby And when you’re posting Check in do the quick, math And then you’ll determine is that engagement rate Where it should be, And what’s also awesome, About brand loyalty is actually 85 % of customers – 85 %.

I know that’s – almost 100, 85 % of customers will actually Engage with your brand if they’re, loyal daily And when I say, engage they’re going to be liking. What you’re posting commenting sharing on a daily basis And that’s huge That constant, like and That constant, following they’re, going to continue to see their stuff and they’re going to continue. To tell their 10 friends and onward and onward and onward All right, so that’s a wrap.

We just covered four ways to measure ROI when it comes to your social media. Make sure you, like this article, subscribe to the blog and ring that bell. If you Wan na see these articles first, This has been The Journey. Thanks for reading


A 2019 traffic generation tool >> Traffic Trapper 2.0


Categories
Online Marketing

4 Ways to Measure Social Media ROI

Also this, I think, determination in small Businesses that they’re like “ There is no way to do this.”, So they love to hear about Roi return on investment. You get asked this too right Right. They end up spending so Much of their time on there, they wan na make sure they’re actually getting something back, Which I totally get right. You’re time is super valuable, you’re doing a million other things and then now social media Is added to your plate? How do you justify the time or the money if you outsource it like GoDaddy Social, You wan na justify that time and money and a way to do that is understand.

Are you getting a return on investment And the good news is there’s a lot of ways to See if you are or not, There’s data analytics metrics, but I’m going to break it. Down into four umbrellas of how to measure ROI, starting with number one brand awareness Cool, how do you Measure brand awareness, So brand awareness can be measured in one way that you’re, probably Already thinking at home, your number of followers How many people are following you More people following you on Twitter, seeing your tweets following you on Instagram Seeing your great photos following you on Facebook and Reading those great captions, The more exposure you have and the more followers you have seeing it that’s brand awareness Perfect And does that count likes and comments, and things like that too Totally So likes comments.

Love shares retweets. That’s just going to help You get in front of not only your followers The awareness there, but your friends and their friends, maybe their family members as well, So the awareness just Spreads like wildfire Spreadin’, the love Spreadin’, the love All right, so digging in On the analytics aspect, It’s easy to see the amount of followers you see the amount of Likes and things like that, is there a step further? We can go to really see the nitty gritty Yeah totally.

So that’s a cool thing. If you have business pages set up, they allow you a clear view of what’s working. What’s not working what time of a day a post works? Well, how many people are seeing It et cetera, et cetera, So with Facebook, you Have your “ Insights” tab And, what’s really cool, is it breaks down a ton of information And they even have a little Information button on each one. So if you’re reading a Metric and it’s like “, I’m not even sure what Engagement rate means.

”, (, laughs, ). You know you click on it. It’ll break down what it is Perfect And Instagram too. You have To make sure you create a or turn your account Into a business profile that way, you can see insights and how many people viewed Your page liked it commented what time of the week you Get the most engagement If you’ve turned your Instagram account into a business page. Let us Know in the comments below Just say, “ I’ve turned It into a business page.

”, So that’s with Instagram Twitter there’s the top tweet. So you can see that in your Twitter analytics as well So go in. There see what Your audience likes, in other words your customers and then have that inform Your strategy moving forward, which will also help you be More efficient with your time and give the customer what they want, Give them what they want, Give them what they want: ( laughs, ) All right, moving on Tip number two: where are we at with that? So tip number two: one Of my personal favorites customer satisfaction And you’re, familiar with This inside your business, whether you have a barbershop Or a car dealership, you can see it on the person’s face that they’re satisfied or not.

I can’t make a frowny face: Aw Darn it I was cuing them up. So one way you can do it. Online with social media is well your reviews. Your customers are going to tell you if they had a poor experience. Or a great experience But make sure you’re Reading those reviews Believe it or not, I still Come across businesses that don’t take the time To read their reviews, I’m like “ Wait. This is a great place “ to see if your customers Are satisfied or not.

” Also what they’re saying when They mention you on Facebook, Right, Especially, you have to Respond good or bad. I know most people will just Respond to the good ones and try to just ignore the bad Ones like they don’t exist, Just give them a response. See if you can make it right, apologize to the situation and move on Totally So again pay attention to What your customers are saying, They’re talking to you online And if you wan na even a Deeper dive into that we have another episode of The Journey on social listening so check it out So cool statistic: I read the other day: actually, a quarter of people who have a positive Experience at a business will go and tell 10 people Both online and offline – That’s pretty awesome.

All right. Tell me What’s tip number three Tip number three is actually Gaining new customers, which is your favorite, I know When I say “ You’re Gaining new customers”, you can picture just dollar Bills in your pocket Make it rain, ( laughs ). So how can you do that with all this social Media and online stuff Couple ways: One: your customers are going to Click on your Google listing for their directions.

I know I do that before Every business I go to because I get lost very easily, But if I’m clicking on the directions, I’m coming to your business and I’m coming to spend Money with intent Also calling Calling you That’s another great way to measure that you’re getting a new customer You’ve already learned. That a lot of customers don’t take the time to call So if they’re calling You they mean business, they are serious about Spending money with you, You got yourself a new customer And so because the Google Listing’s really important Yelp and that “ Click to call” you wan na, make sure I’m sure this obvious that everything is up to date, The right phone number, the right address The hours right.

How many times have you gone to a business? That said it was open, you get there and it’s closed And that’s a bummer Just makes me so sad. So sad, And also besides that, if you have a chance to Speak about your business, maybe “ About You” or add Photos do that as well too and make sure that’s up to date, Maybe you’ve remodeled. Since the last time you had your Yelp photos. Updated or your Google Add that in there spice things up Take some photos, Keep it up to date, so When your customer comes in that new customer, you just gained they’re getting an experience.

That they predicted that they expected Right All right, so we’ve reached The end of our journey, We’re on tip number Four, the very last one: What do you got for us Brand loyalty, Another one you’re familiar With the terminology, but what does it look like online? Well, there’s, don’t worry, It’s not tough math, but well, let’s see how It goes for Justin here All right, engagement rate. How do you measure that? Well, it’s pretty easy.

It’s the number of likes You receive on a post divided by the number of followers times. You guessed it 100 And that’s going to equal Your engagement rate ( mumbles ), Oh no! No! It’s not that hard, So write it down, keep it nearby And when you’re posting Check in do the quick, math And then you’ll determine is that engagement rate Where it should be, And what’s also awesome, About brand loyalty is actually 85 % of customers – 85 %.

I know that’s – almost 100, 85 % of customers will actually Engage with your brand if they’re, loyal daily And when I say, engage they’re going to be liking. What you’re posting commenting sharing on a daily basis And that’s huge That constant, like and That constant, following they’re, going to continue to see their stuff and they’re going to continue. To tell their 10 friends and onward and onward and onward All right, so that’s a wrap.

We just covered four ways to measure ROI when it comes to your social media. Make sure you, like this article, subscribe to the blog and ring that bell. If you Wan na see these articles first, This has been The Journey. Thanks for reading


Who is helping with your digital business footprint?